These Numbers Show How Gas Prices Are Impacting Montanans
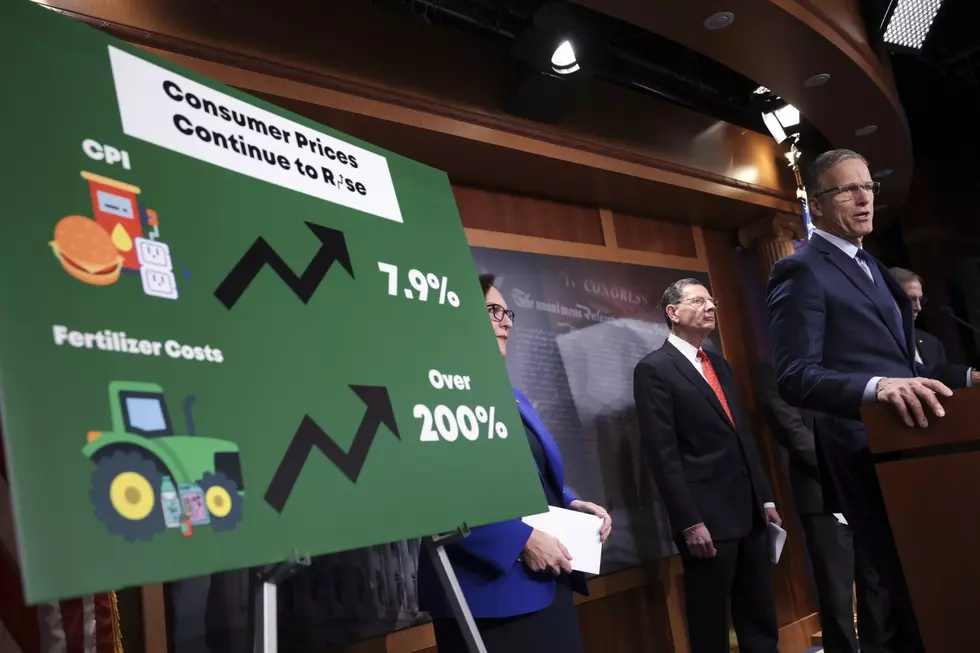
Steve Moore's Committee to Unleash Prosperity featured a cartoon highlighting inflation and the high price of EVERYTHING. The cartoon by Dick Wright with CagleCartoons.com showed a woman asking another woman in a long line of grocery carts- "Is this the line for eggs, chicken, ground beef, pet food, or baby formula?"
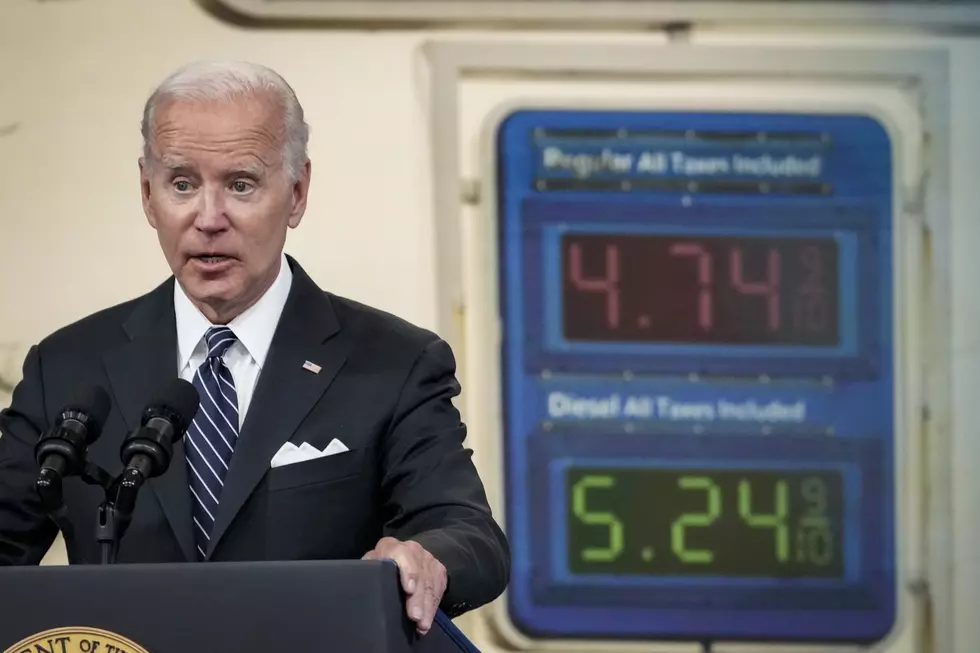
Yes, it seems under the Biden Administration, the price of EVERYTHING has gotten worse- especially gas prices.
Evelyn Pyburn shared some very interesting business news in not only the Big Sky Business Journal Hot Sheet, but also in the print edition of the Big Sky Business Journal. In the July 15th print edition, she shared a report that shows gas usage in Montana has gone down by 7%. Nationwide gas usage has gone down by 19%.
As Evelyn notes, Montana is known for wide open spaces and long distances to travel, so it would make sense why our fuel consumption didn't go down as much as elsewhere. We also have industries that depend on fuel to run.
(And thanks to a newly elected Republican Governor and Legislature, our economy is faring better than most of the "blue" states, as noted by the record Montana workforce reported in the Hot Sheet on Monday)
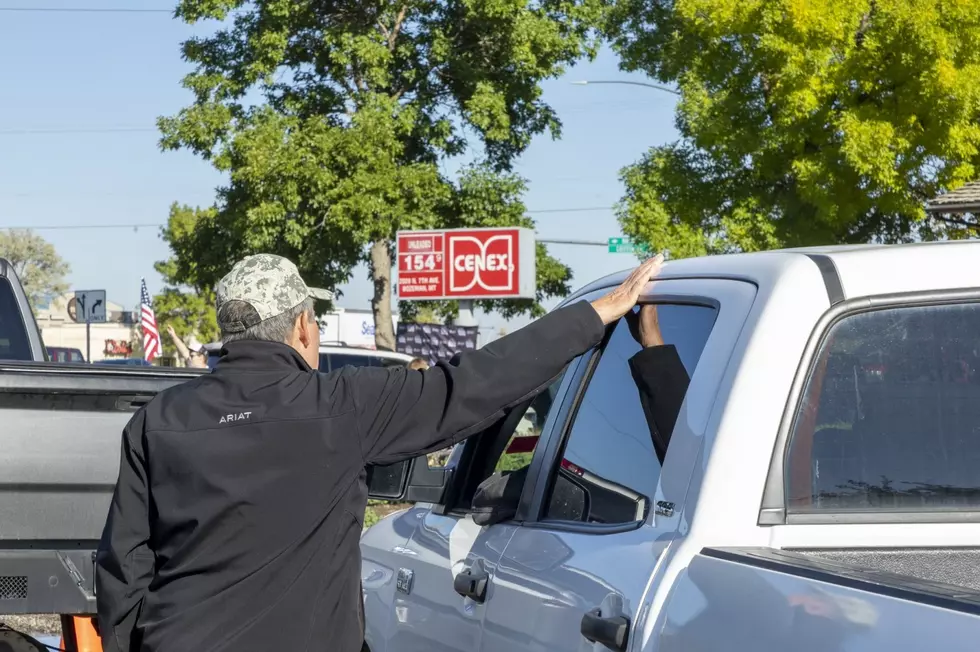
According to Quote Wizard, Montana drivers are using 149,000 gallons of gas each day than in 2021. Evelyn also reported that "the average Montana driver now uses 411 gallons of gas every month." Multiply that times the $5 a gallon gas we've been paying for under Biden, and that's a lot of cash.
Also in the Big Sky Business Journal is a report from the Institute for Energy Research, which says that the idled US refineries are not likely to come back online. The report notes that "refiners are unlikely to invest hundreds of millions of dollars in recommissioning costs for only one or two years of strong returns, against a backdrop of the Biden Administration's promise to 'end fossil fuels.'
Click here to subscribe to both the Big Sky Business Journal print edition and the Hot Sheet.
LOOK: See how much gasoline cost the year you started driving
More From Montana Talks


